tl;dr Just like Facebook posts aren’t representative of real life, fund raising and liquidity aren’t representative of startup experiences.
Secret is a beautiful new app that has taken the silicon valley by storm. It creates a clever semi-anonymous network using your phone’s address book. Secret lightly masks a poster identity, while creating an environment where you likely know the person creating the anonymous content. In the Secret founders own words:
We built Secret for people to be themselves and share anything they’re thinking and feeling with their friends without judgment.
To me, Secret represents a return to authenticity in a world where most of the established networks are increasingly focused on braggadocio and self-promotion.
While enjoying the app this week, I’ve been struck by some vitriolic posts / comments expressing extreme dislike of some high flying start ups and founders. When discussing this phenomenon, it struck me that this may also be part of the trend driving the app development in the first place. Authenticity is missing both in our online social interactions as well as in broader early stage technology press coverage. To often we hear only hear about fund raising, acquisitions and startup successes. Examination of how incredibly difficult startups is much more rare. (For those interested, Ryan Hoover has a great list of startup postmortems). This skewed view of the world would be referred to as a survivorship bias in statistics. I’d like to believe that these posts are part of a reactionary trend toward authenticity as opposed to blind hatred.
Just like Facebook posts aren’t representative of real life, fund raising and liquidity aren’t representative of startup experiences.
Survivorship Bias
The lack of examination of failures in addition to success, leads to a survivorship bias. The best illustration of survivorship bias I’ve heard is the story of Abraham Wald, an early operations researcher (now called data scientist).
Wald applied his statistical skills in World War II to the problem of bomber losses to enemy fire. A study had been made of the damage to returning aircraft and it had been proposed that armor be added to those areas that showed the most damage. Wald’s unique insight was that the holes from flak and bullets on the bombers that did return represented the areas where they were able to take damage. The data showed that there were similar patches on each returning bomber where there was no damage from enemy fire, leading Wald to conclude that these patches were the weak spots that led to the loss of a plane if hit, and that must be reinforced wikipedia
Examining only the successful planes would lead the military to believe they should reinforce areas with bullet damage. This is a logical fallacy, the correct conclusion that Wald famously drew was the planes with damage in other areas didn’t survive to make it home.
Unicorns
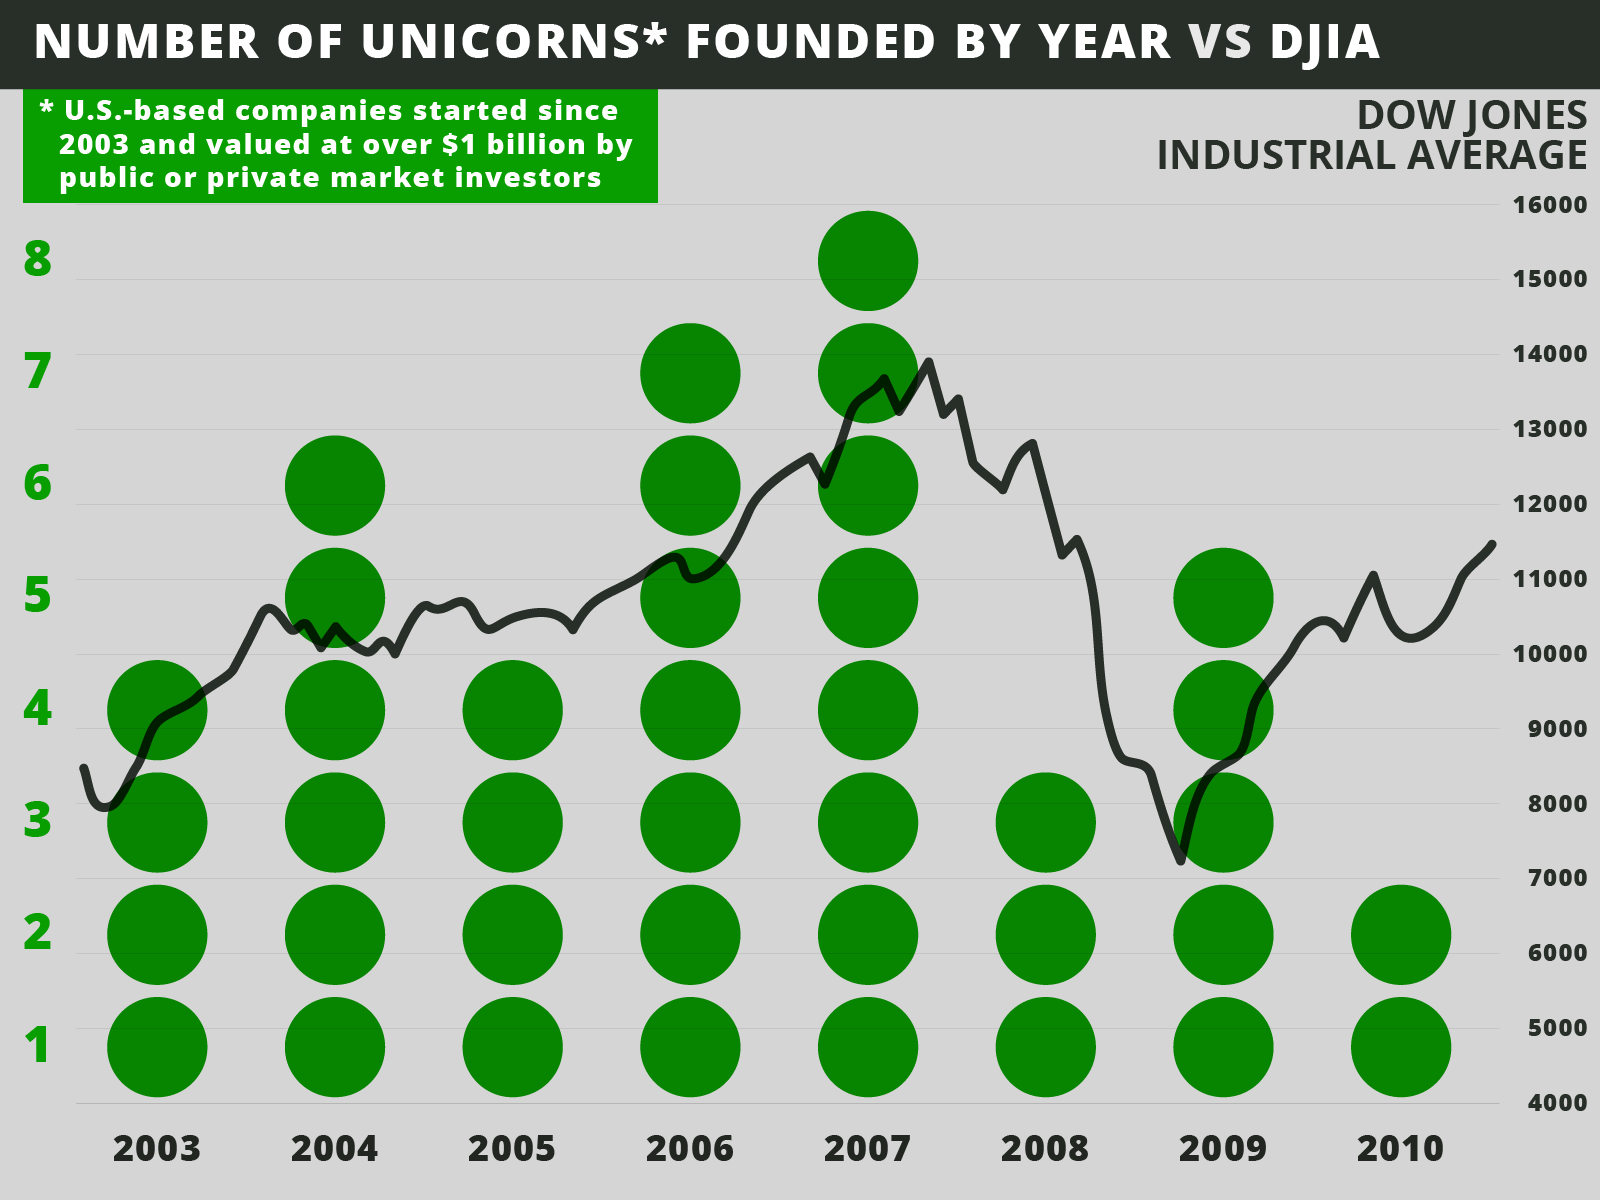
In a great analysis of the unicorn club, Aileen Lee examined ~40 companies that have been valued greater than $1B. This analysis was fascinating and sparked a great conversation around the drivers for startup success. But, as Aileen recognized, only looking at successes can lead to incorrect conclusions.
Quick analysis
As the data behind many of the drivers is difficult to obtain, I’ll take a look at a simple but still illustrative example of how successes can be misleading.

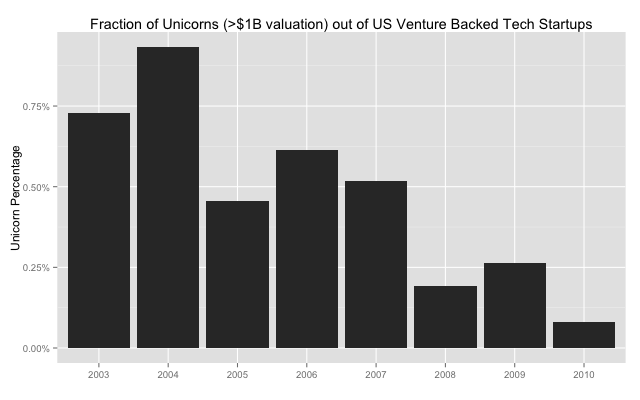
Looking at just the raw aggregate number of unicorns, it appears that 2006 and 2007 are the most successful years yielding the most unicorns. Taking a look at Crunchbase data, we can normalize these unicorn outcomes by the total number of companies started.

In fact, 2003 and 2004 appear to be more successful when considering the broader population and 2009 appears to be relatively weaker (likely due to the fact that unicorns take 7-10 years).
Takeaway
With an analysis of just survivors, we neglect the conditional probabilities. The question should be, “given a company was founded in a year, what is the likelihood of their becoming a unicorn?” With this analysis, startup outcomes isn’t causally related to the founding year. This is a demonstration of correlation as with many other confounding variables, one of which Aileen demonstrated with the inclusion of the DJIA.
It will be interesting to see how this trend toward authenticity plays out. I for one will drive to a more comprehensive view of startups.
Code and Data
Here is a R script for generating graphs and see Crunchbase and Aileen’s post for the raw data.
