
When I co-founded PrimaTable, a restaurant marketplace startup, I had prior experience within Google’s Adwords and YouTube’s media marketplace. Taking the plunge, I tried to systematically learn about marketplaces from as many public company as possible. Unfortunately, many marketplace companies don’t report on the essential operational metrics (unit economics, CAC, LTV, liquidity, geographic density …) and require crude assumptions to decompose their performance. OpenTable was my closest comparable and reports nearly a complete set of supply side unit economics going back to 2006. Let’s take a look at their business.
History
Founded in 1998, OpenTable is a two-sided local marketplace connecting diners with restaurants. OpenTable started as a restaurant electronic reservation book (ERB). To grow their marketplace, OpenTable focused on single side utility, adding value to restaurants focused on customer service with a CRM and table management system. OpenTable focused on liquidity in a local geography prior to broader expansion. After the aggregation of a comprehensive list of restaurants in a metropolitan area, OpenTable.com provides value to consumers by facilitating the discovery of reservation availability.
Acquired by Priceline in July of 2014 for $2.6B, OpenTable takes reservations currently has over 32K restaurants internationally and has seated over 665 million dinners.
In this post, I’ll dig into OpenTable’s business with a focus on opportunities Priceline can capture. Priceline has stated a focus on three strategic areas (SAs) post-acquisition:
- International expansion
- Demand generation
- Marketplace innovation, especially in mobile
OpenTable’s business model is very similar to Priceline’s, in demand generation, supply aggregation and operational needs. Like hotels and airlines in the travel industry, restaurants have a high fixed cost and low variable cost (35%). To maximize profit, restaurants want to be at 100% occupancy and have significant margin to spend to acquire customers. Unlike Priceline, OpenTable has a much more frequent but lower margin and volume transaction.
Stage
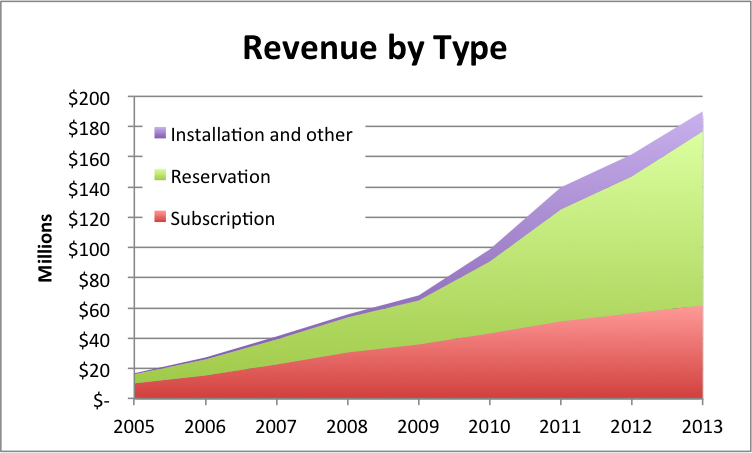
OpenTable has grown to nearly $200M in revenue. The fastest growing portion of their revenue is reservation performance marketing product. SA #2 post-acquisition will be to focus on the marketing products further increasing the growth within performance marketing.
Network effects
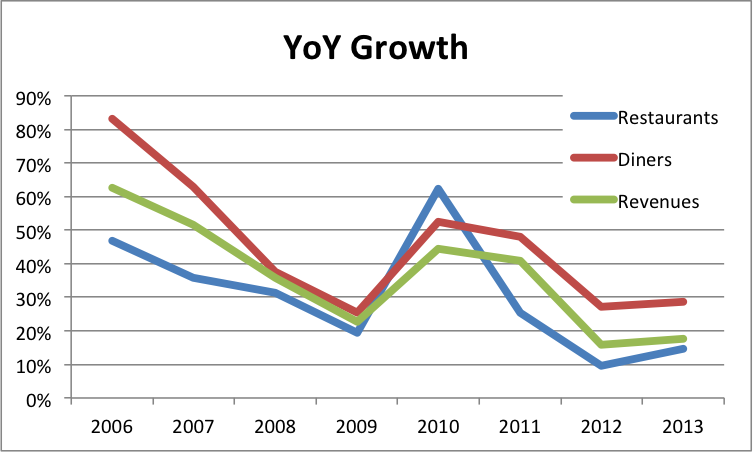
The beauty of marketplace businesses is - at liquidity there are strong network effects. Year over year growth in diners has consistently outpaced that of restaurants (outside of the Top Table acquisition in 2010). This is due to the increased value that each incremental user of OpenTable has due to the comprehensive coverage of supply. As OpenTable focuses on SA #3 marketplace innovation, expect revenue growth to begin to outpace even diner growth. OpenTable can offer additional value to both consumers and restaurants by creating a more efficient market.
Unit Economics
Restaurant Acquisition
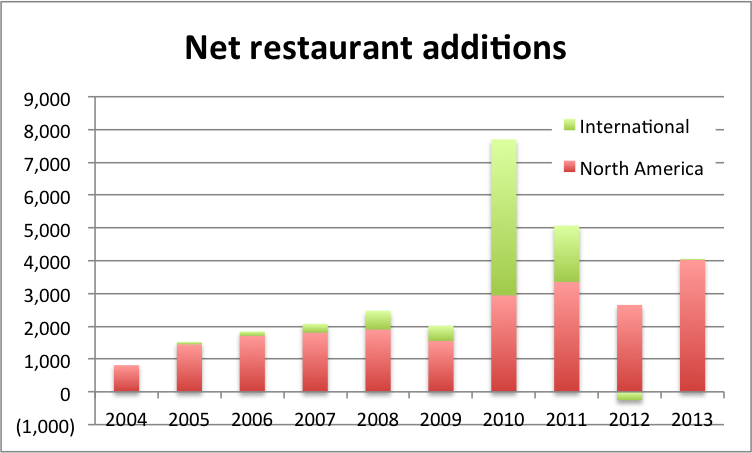
While OpenTable doesn’t break out restaurant churn and acquisition, they report aggregate numbers so we can compute net additions. Note that European growth has slowed since the acquisition of Top Table in 2010 for $55M. SA #1 post-acquisition is to accelerate OpenTable’s international expansion. Priceline’s Booking.com is very strong in Europe and works with >530K properties. Supply acquisition should be synergistic.
Restaurant Acquisition Cost
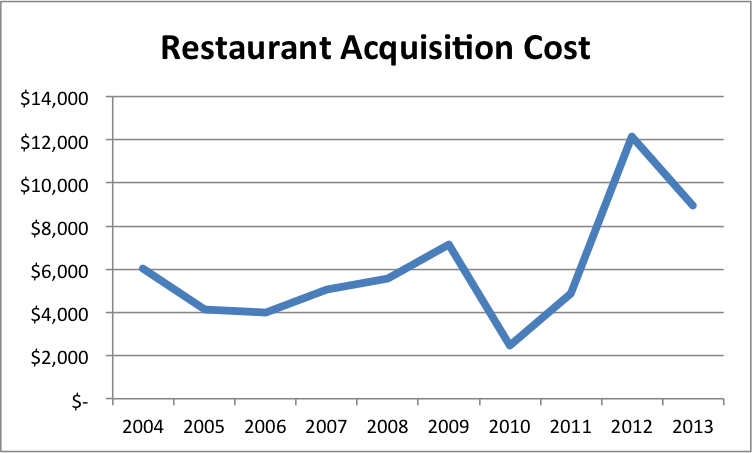
OpenTable doesn’t spend on marketing for user acquisition. Focusing exclusively on high quality restaurants (supply) generates sufficient demand. Given that SA #2 will be to further increase demand generation and that Priceline is one of the top advertisers on Google spending $1.8B online in 2013, I’d expect the lack of consumer marketing for OpenTable to change. Thankfully it hasn’t yet. We can look at OpenTable’s reported sales and marketing costs and net restaurant additions to understand the cost to acquire a new restaurant.
Restaurant Revenue
Unfortunately, OpenTable doesn’t break out restaurant revenue by cohort and tenure. However, we can get a sense for what the unit economics look like by taking the average revenue per restaurant, the average support costs per restaurant and the acquisition costs above.
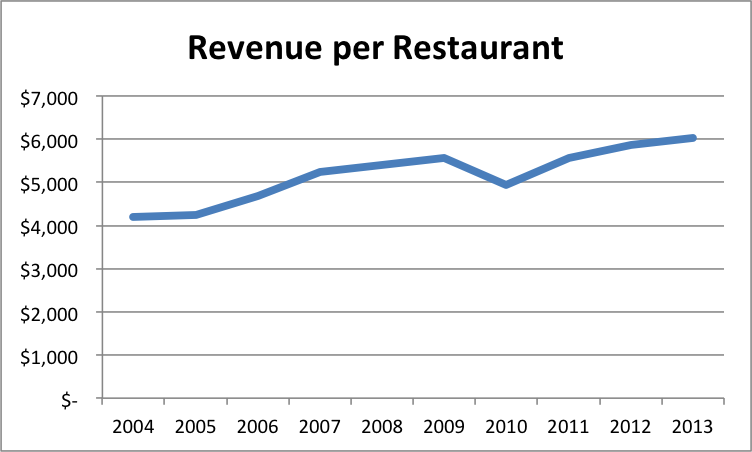
The average OpenTable restaurant generates $6K / year, costs $655 / year to support and takes $9K to acquire. Assuming that restaurants ramp to average revenue immediately, it takes approximately 1.5 years to pay back the acquisition costs on the supply side.
Restaurant Value
Per Diner:
At the standard OpenTable fee of $1 per diner3, a restaurant still makes a profit even if OpenTable cannibalizes 96% of diners.
Sophisticated restaurateurs recognize that cannibalization varies by the day of week and the time of day and block off inventory that they know will otherwise book at peak times (where cannibalization could be 100%). There are times where a restaurant will never be full and wouldn’t need to take a reservation. The average incremental diner has a very different value accordingly. OpenTable has explored dining incentives at non-peak shoulder times with their 1000 point listings (offering a $10 value to diners for which the restaurant pays OpenTable $7.5). My startup, PrimaTable, attempted to address the peak times. A series of startups have now subsequently popped up.
Conclusion
Booking.com pioneered the merchant model. By starting at a low 10% margin and offering favorable cash flow terms, Booking.com created a marketplace where hotels control pricing and bid in an auction with margin. In this Adwords like auction, hotels are able to bid for better placement (and thus visibility). Booking.com started with a low rake to get broad supplier adoption, added in an auction pricing dynamic that is market driven allowing suppliers that want volume or exposure to pay more.
An interesting parallel between OpenTable and the initial days of Booking.com can be made. OpenTable creates a lot of value for restaurants and consumers. There is a lot left to do, consumer demand generation, marketplace innovation for restaurants, and international growth are where I would start.
Data
-
instead of their reported weight average cost of a reservation of $.73 in 2013 ↩